
Your choice regarding cookies: We use cookies when you use this Website. These may be 'session' cookies, meaning they delete themselves when you leave the Website, or 'persistent' cookies which do not delete themselves and help us recognize you when you return so we can provide a tailored service. However, you can block our usage by adjusting your browser settings to refuse cookies.
Summary
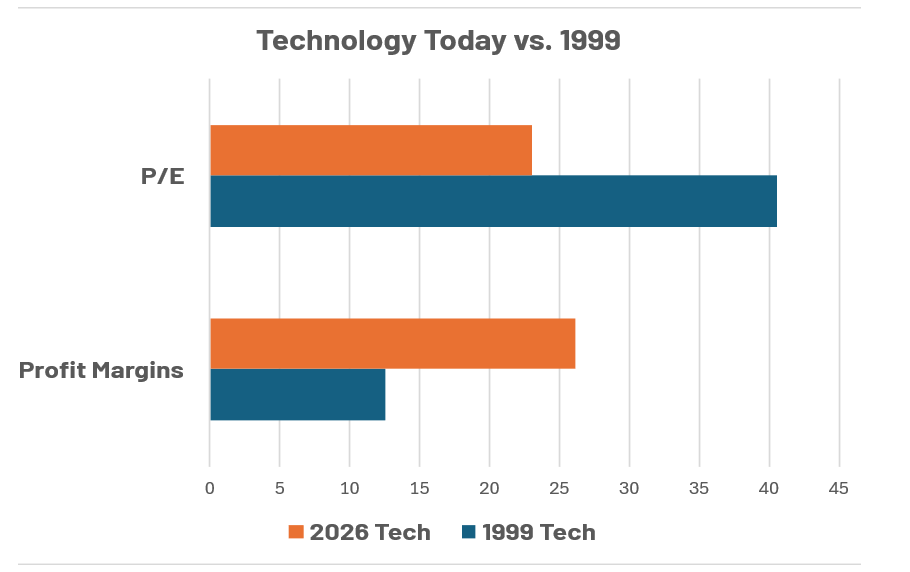
- Today's tech has better valuations and margins than 1999.
- Tech free cash flow above earnings — no bubble signal yet.
- Pullbacks are healthy; we stay overweight tech for now.
The questions in our inbox have gotten louder lately. Are we reliving 1999? Has the tech rally reached the dangerous ‘Euphoria’ bubble stage we first discussed in our 2026 Outlook? And is the recent surge in initial public offerings (IPOs)— led by SpaceX on Friday— diluting existing holders just as valuations were already drawing scrutiny?
We understand the concern. With the Iran war keeping energy prices elevated and interest rates stubbornly high, this is not a risk-free environment for growth assets…as the recent volatility in the Nasdaq demonstrates. But despite those potential headwinds, we remain overweight US technology in our portfolios. Here’s why.
This Isn't 1999 — At Least Not Yet, According to Valuation
In the late 1990s, technology stocks were priced for perfection, on top of fundamentals that were anything but perfect. Today, the picture looks materially different to us on two key dimensions: valuation and earnings quality. Chart 1 below tells the story clearly: the MSCI USA Information Technology Index currently trades around 23x forward earnings, versus 40x at the peak of the dot-com bubble. This current valuation represents only a ~10% valuation premium to the S&P 500, despite much stronger revenue and earnings growth for tech. Critically, profit margins have moved in the opposite direction — over 26% today versus 13% in 1999. You're paying a lot less in 2026 for better businesses.
Yes, tech valuations are sensitive to rising interest rates — higher rates compress the multiples warranted for long-duration growth assets, all else remaining equal. If the Iran conflict continues driving energy-related inflation and forces rates higher still, valuation headwinds are real. We're watching this closely. But last week's softer-than-expected core CPI print — which suggests underlying inflation ex-energy may be better behaved than feared — provides some reassurance that the rate picture isn't uniformly bleak. Given the soft unit labor costs discussed in last week’s Weekly View, we believe that the core inflation story is more moderate than feared.
The #1 'Tell' for When to Leave the Party is Cash Flow— No Warning Signal Here Yet, In Our View
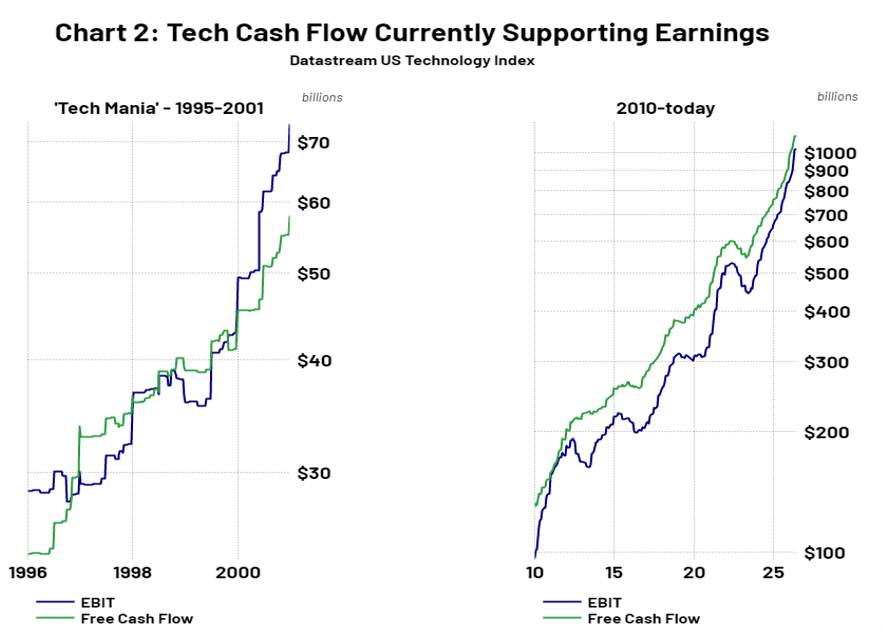
If valuation is the warning light on the dashboard, free cash flow is the engine itself. In our view, the single most important early warning signal for when an equity bubble may burst is the divergence between reported earnings before interest and taxes (EBIT) and free cash flow — when reported profits race well ahead of actual cash generation, it's a sign that hype is outrunning fundamentals.
Look at the left panel of the cash flow chart (Chart 2, right). Towards the end of the 1995–2001 ‘Tech Mania’ phase, EBIT (blue line) continued to climb sharply while free cash flow (green line) lagged — the classic signature of deteriorating earnings quality. Now look at the right panel: today, free cash flow is running above EBIT across the US technology sector — approaching $1 trillion on an annualized basis, x times 2000’s tally — and continues to do so consistently. That is the opposite of a bubble signal. It tells us that tech's reported earnings are being validated by actual cash coming in the door. Until that relationship inverts, we believe the fundamentals support staying invested in mega-cap, high cash flow tech shares.
On the IPO Supply Question: We Believe US Indices Can Handle It
A word on the equity supply concern: we're less worried than some. The US equity market is the deepest, most liquid stock market in the world; we expect it to be able to absorb supply shocks without structural damage. With $77 trillion in the broad Russell 3000 and $65T in the more widely followed S&P 500, SpaceX’s expected $75B issuance represents a small fraction of the market’s capitalization… especially when considering ~$8T of liquidity sitting in money markets. And while IPO issuance is heating up, from a historical perspective it is less extreme – roughly 100 expected IPOs this year compares to 250 in 2021 and 400 in 1999, according to Goldman Sachs. Furthermore, Goldman expects buybacks and M&A to more than offset new equity supply in the US this year.
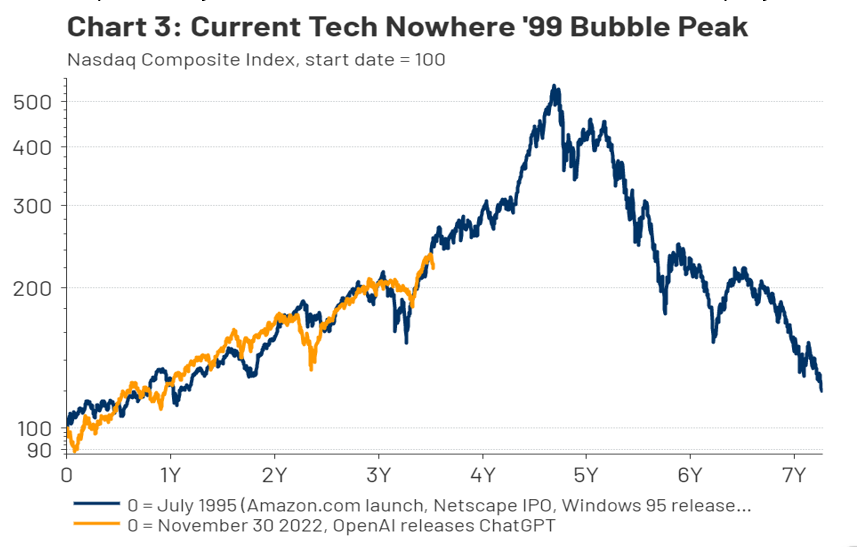
The Nasdaq overlay chart to the right is instructive — if history rhymes, the current AI-era tech bull market (orange line) may still have significant runway ahead before reaching a 1999-style apex (blue line). But "significant runway" doesn't mean "straight up." Regular pullbacks — like the -5% drawdown day in the Nasdaq on June 5— are healthy. They bleed off excessive optimism before it becomes euphoria. Instead of the price chart, watch the cash flow chart. The day free cash flow begins to meaningfully trail EBIT across the technology sector — the way it did in 1999 and 2000 — is the day to start considering underweight tech. That signal will matter more to us than any individual valuation multiple or macro headline. But for now, that signal is not flashing. The party continues — and we intend to stay for a while.
Risk Discussion: All investments in securities, including the strategies discussed above, include a risk of loss of principal (invested amount) and any profits that have not been realized. Markets fluctuate substantially over time, and have experienced increased volatility in recent years due to global and domestic economic events. Performance of any investment is not guaranteed. In a rising interest rate environment, the value of fixed-income securities generally declines. Diversification does not guarantee a profit or protect against a loss. Investments in international and emerging markets securities include exposure to risks such as currency fluctuations, foreign taxes and regulations, and the potential for illiquid markets and political instability. Please see the end of this publication for more disclosures.
Download 06.16.2026 | Weekly View
Authored by
-

Chris Konstantinos CFA®
Managing Partner | Chief Investment Strategist