
Your choice regarding cookies: We use cookies when you use this Website. These may be 'session' cookies, meaning they delete themselves when you leave the Website, or 'persistent' cookies which do not delete themselves and help us recognize you when you return so we can provide a tailored service. However, you can block our usage by adjusting your browser settings to refuse cookies.
SUMMARY
- Neither valuation, leverage nor sentiment reflect ‘Bubble’ behavior yet, in our view.
- Base Case: Further upside for US stocks, due to AI spending, an accommodative Fed, and no recession.
- In 2026, we are watching risks related to credit, inflation and Fed policy; 2nd years in Presidential cycles are typically volatile.
RiverFront's Investment Team is proud to present the summary of our 2026 Outlook, which will be released this Friday, December 19th. In 2025, the tech-heavy US stock market rode a wave of AI awareness and spending. In ’26, our Base Case (see Table 1, below) is that this spending ‘Boom’ will continue – thereby avoiding a recessionary ‘Bust’ - but with enough emotion and controversy to avoid ‘Bubble’ mania. We continue to favor stocks over bonds, and US assets over international.
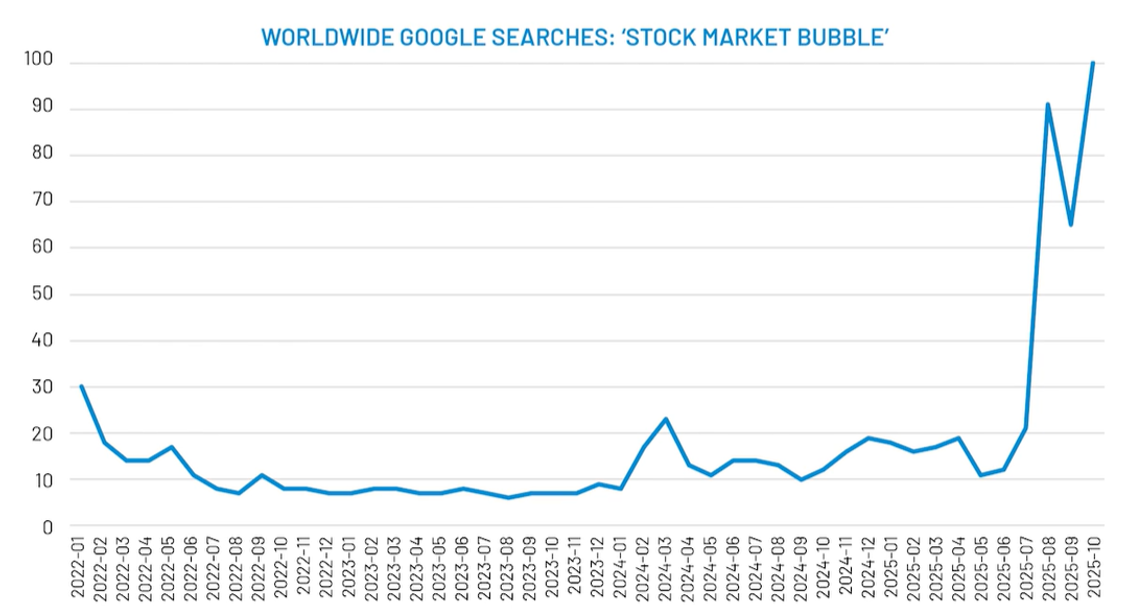
The question we fielded most often this year was “are we in a market bubble?” Judging by the near-record number of Google searches in Q4 for ‘stock market bubble’ (see Chart 3, last chart below), we do appear to have a ‘bubble’ in bubble concerns! All kidding aside, cautious sentiment like this may be one of the clearest indicators that the stock boom still has room to go, in our view.
Bubbles are only obvious in retrospect. But, in studying classic US bubbles in the 1920s and the 1990s, neither valuation, leverage nor sentiment today resembles ‘Euphoria’-stage bubble behavior, in our view. And if tech spending eventually does cause a bubble, it is our belief that we are only in the ‘Boom’ phase of that bubble anatomy…suggesting that the most powerful part of the bull market may still be ahead of us. Mapping the recent Nasdaq rally that started with the release of Chat-GPT in late 2022 onto the 1994-2001 stock experience lends some credence to this view (Chart 1, after Table 1, below).
However, a better analog may instead be the growth stock ‘boom’ of the late 1950s and 1960s, as epitomized by the Dow Jones (DJIA – see Chart 2, below). Similar to today, this period experienced elevated economic growth, inflation, and stock valuation, driven by tech-led productivity gains and a growing consumer demographic. If the 50s and 60s are any guide, we may only be in the early stages of what could be a less powerful but more sustained stock ‘Boom’… rather than in the midst of a euphoric ‘Bubble’.
Table 1: RiverFront’s 2026 Outlook Forecasts (Base, Bull & Bear Cases)
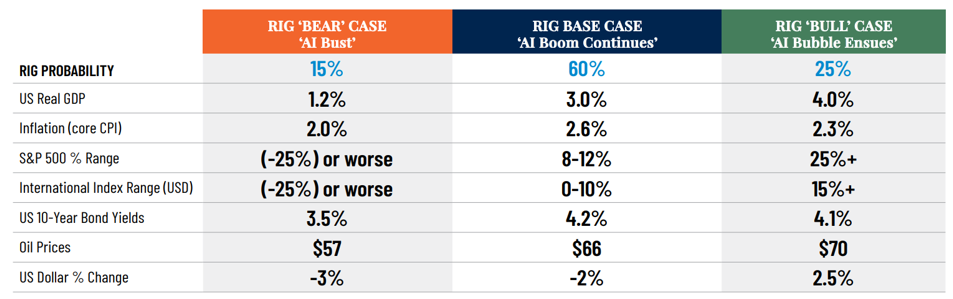
CHART 1: Where We Could Be Today, Relative to the 1990s Tech ‘Bubble’ Cycle…
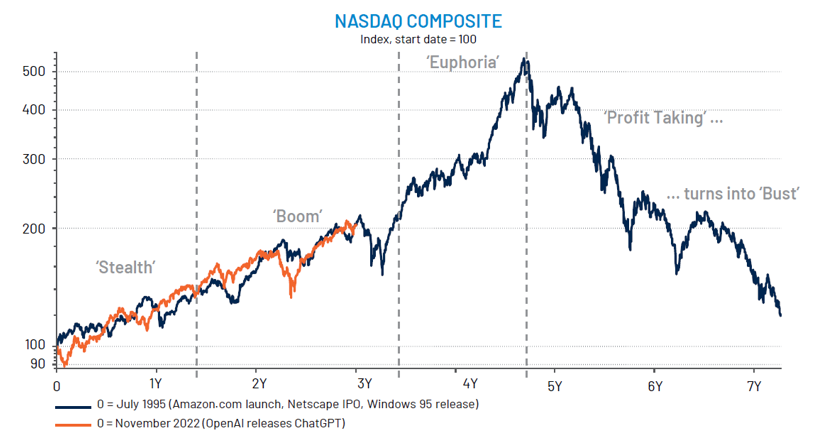
CHART 2: …But Is It a Bubble At All? A More Likely Alternative is 1960s-Style ‘Boom’, In Our View
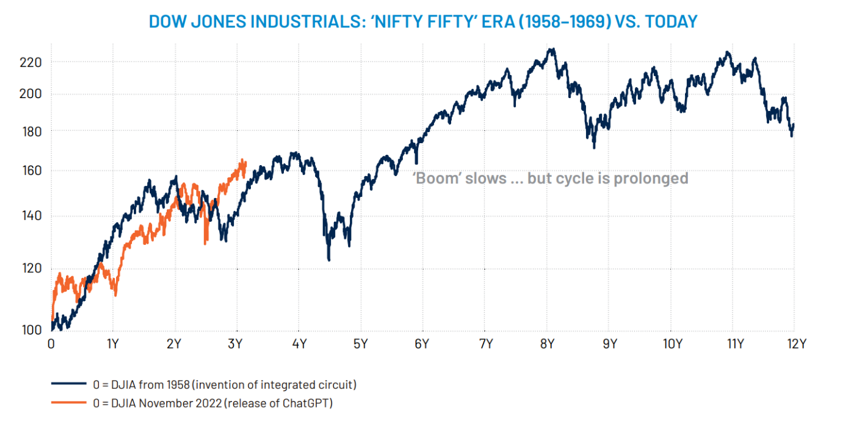
CHART 3: We Do Have A Bubble… In Bubble Talk!
Risk Discussion: All investments in securities, including the strategies discussed above, include a risk of loss of principal (invested amount) and any profits that have not been realized. Markets fluctuate substantially over time, and have experienced increased volatility in recent years due to global and domestic economic events. Performance of any investment is not guaranteed. In a rising interest rate environment, the value of fixed-income securities generally declines. Diversification does not guarantee a profit or protect against a loss. Investments in international and emerging markets securities include exposure to risks such as currency fluctuations, foreign taxes and regulations, and the potential for illiquid markets and political instability. Please see the end of this publication for more disclosures.
Download 12.16.2025 | Weekly View
Authored by
-

Chris Konstantinos CFA®
Managing Partner | Chief Investment Strategist