
Your choice regarding cookies: We use cookies when you use this Website. These may be 'session' cookies, meaning they delete themselves when you leave the Website, or 'persistent' cookies which do not delete themselves and help us recognize you when you return so we can provide a tailored service. However, you can block our usage by adjusting your browser settings to refuse cookies.
SUMMARY
- The Fed has recommenced a rate cutting cycle, which is historically positive for stocks.
- US earnings revisions stay strong heading into the 4th quarter.
- Our balanced portfolios remain overweight US stocks, with preferences for mega-cap tech and financials.
We are excited to release our October 2025 Chart Pack, our visual quarterly designed to walk investors through what is happening in markets and why, what may come next, and how we are positioning RiverFront portfolios. In today’s Weekly View, we picked three Chart Pack visuals to highlight.
The quarter saw a renewed focus around central bank policy. The US Federal Reserve (Fed’) recommenced an interest rate cutting cycle that began in earnest a year ago before being paused (blue line, Chart 1 below). Signals coming from the fed funds futures market suggest that the Fed is not likely done cutting rates, implying roughly 100 basis points (i.e., 1%) more cuts by September 2026 (red line in Chart 1). Importantly, historical analysis suggests that rate cuts tend to be positive for US stock market returns (Chart 2, below).…especially if the economy doesn’t fall into recession within a year of the first cut.
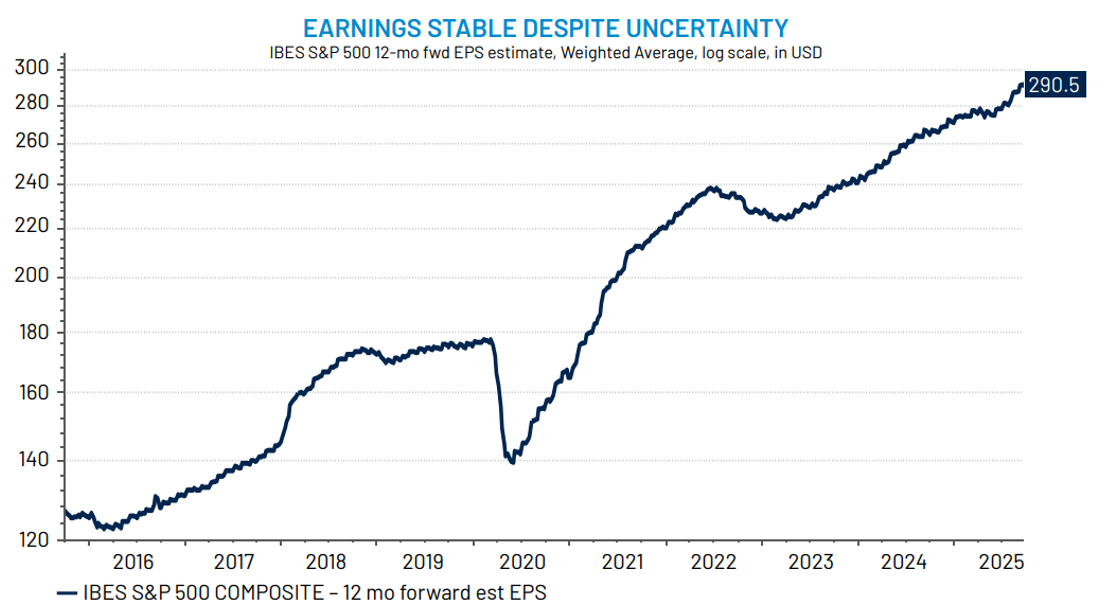
With monetary policy easing into an economy that shows little signs of recession, stocks could continue to show further upside from here. To this point, S&P 500 earnings revision momentum continues to accelerate (Chart 3, below), highlighting the resilience of ‘American Economic Exceptionalism’. RiverFront’s balanced portfolios remain overweight US stocks. We still favor high cash flow-generating tech companies, in the face of continued robust investment in artificial intelligence (‘AI’) and cloud computing. We also see attractive opportunities in financials. Both sectors offer more attractive opportunities in our opinion versus traditional ‘defensive’ plays such as consumer staples and utilities.
Chart 1: Market Pricing in More Rate Cuts Over the Next Year…
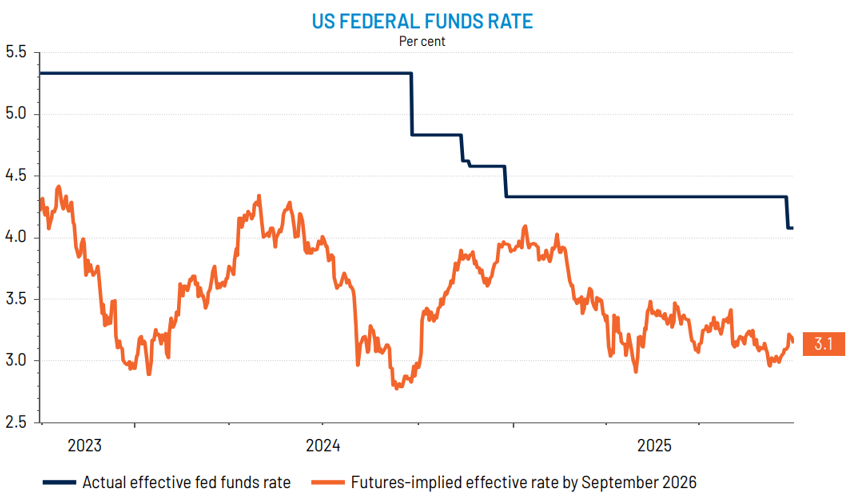
Chart 2: …Which Tend to Be Good for Stocks (Especially in the Absence of a Recession)
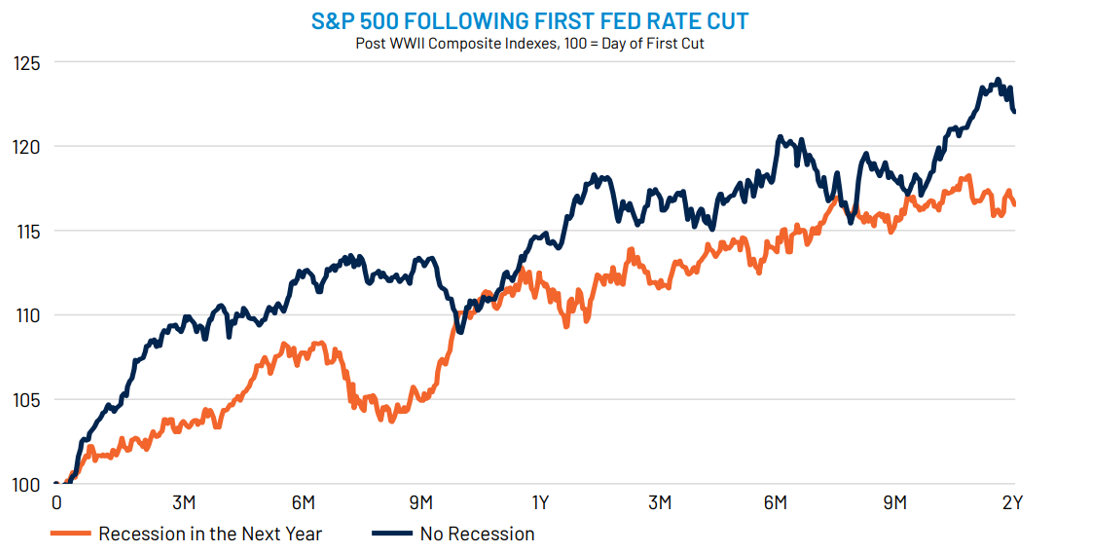
Chart 3: US Corporate Earnings Continue to Show Strong Momentum
Risk Discussion: All investments in securities, including the strategies discussed above, include a risk of loss of principal (invested amount) and any profits that have not been realized. Markets fluctuate substantially over time, and have experienced increased volatility in recent years due to global and domestic economic events. Performance of any investment is not guaranteed. In a rising interest rate environment, the value of fixed-income securities generally declines. Diversification does not guarantee a profit or protect against a loss. Investments in international and emerging markets securities include exposure to risks such as currency fluctuations, foreign taxes and regulations, and the potential for illiquid markets and political instability. Please see the end of this publication for more disclosures.
Download 10.14.2025 | Weekly View
Authored by
-

Chris Konstantinos CFA®
Managing Partner | Chief Investment Strategist