
Your choice regarding cookies: We use cookies when you use this Website. These may be 'session' cookies, meaning they delete themselves when you leave the Website, or 'persistent' cookies which do not delete themselves and help us recognize you when you return so we can provide a tailored service. However, you can block our usage by adjusting your browser settings to refuse cookies.
SUMMARY
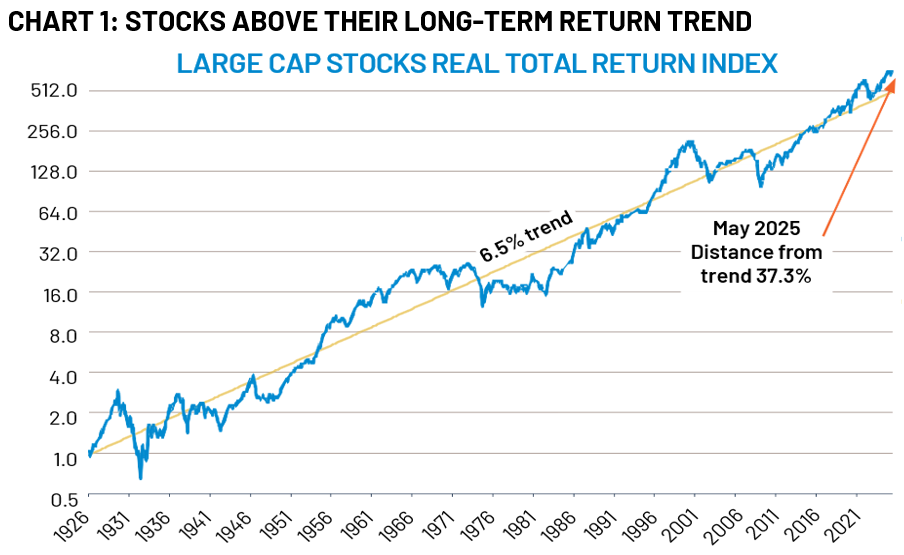
- US stocks are trading above their own return trend, suggesting lower long-term returns, in our view.
- However, strong fundamentals suggest to us that stocks could stay above trend for some time.
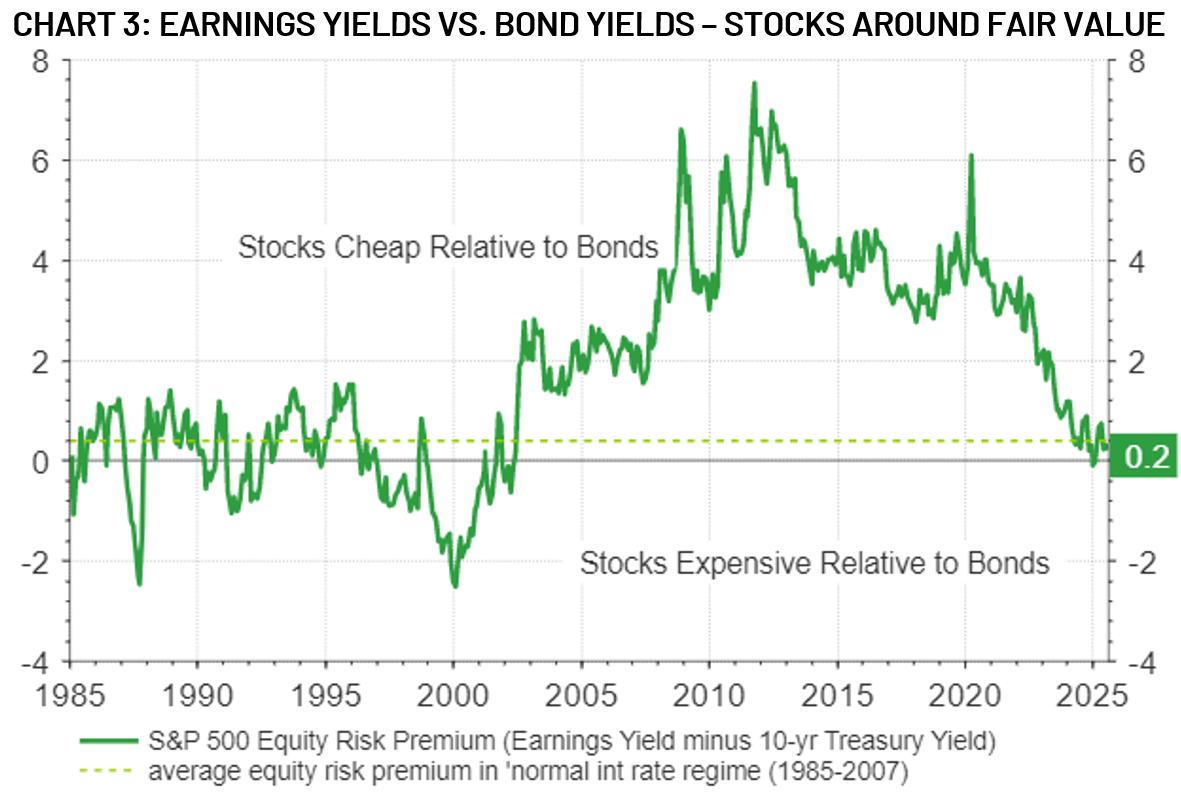
- Stock valuations relative to bonds are no longer ‘cheap’ in our view…but neither are they ‘expensive.’
In asking financial advisors and clients what is most on their minds concerning markets, we found that concern about US stock valuation was top of mind. We believe that ‘value’ is in the eye of the beholder and thus deserves a thoughtful analysis.
For US large-cap stocks, it is tempting to look at the last few years’ outsized gains and the 12-month forward price-to-earnings (P/E) ratio of ~22.5x and conclude stocks are ‘expensive’. However, the answer is more nuanced, in our view. At the risk of dramatically oversimplifying, there are at least two distinct frameworks to look at stock valuation:
- In absolute terms: i.e., in comparison to that asset’s own history
- In relative terms: i.e., in comparison to other assets such as US bonds
CONCLUSION: Stocks Look Pricy Relative to History… but Fundamentals and Interest Rates Suggest They Could Stay That Way
In absolute terms, a 22.5x forward P/E ratio sits well above the 40-year average of about 16x. In addition, US large-cap stocks are currently trading ~ 37% above their century-long real total return trend (Chart 1). RiverFront’s historical analysis of this data – known as ‘Price Matters’ - suggests that returns over the subsequent decade from today’s starting place are likely to be lower than average… a conclusion that concurs with our Long-Term Capital Market Assumptions (CMAs). However, valuation is not necessarily a good timing tool – assets that appear expensive often grow more expensive over time, and vice versa. Instead, we think valuation must be placed into proper context to be useful to investors with time horizons shorter than a decade.
Against the current context of solid underlying fundamentals, 22.5x earnings appear justified to us. Corporate earnings growth has been robust, generating strong cash flows and leading to sustainably higher profit margins. Since we don’t anticipate a recession in the foreseeable future, and think inflation resulting from tariffs will be contained, we think current valuations could persist.
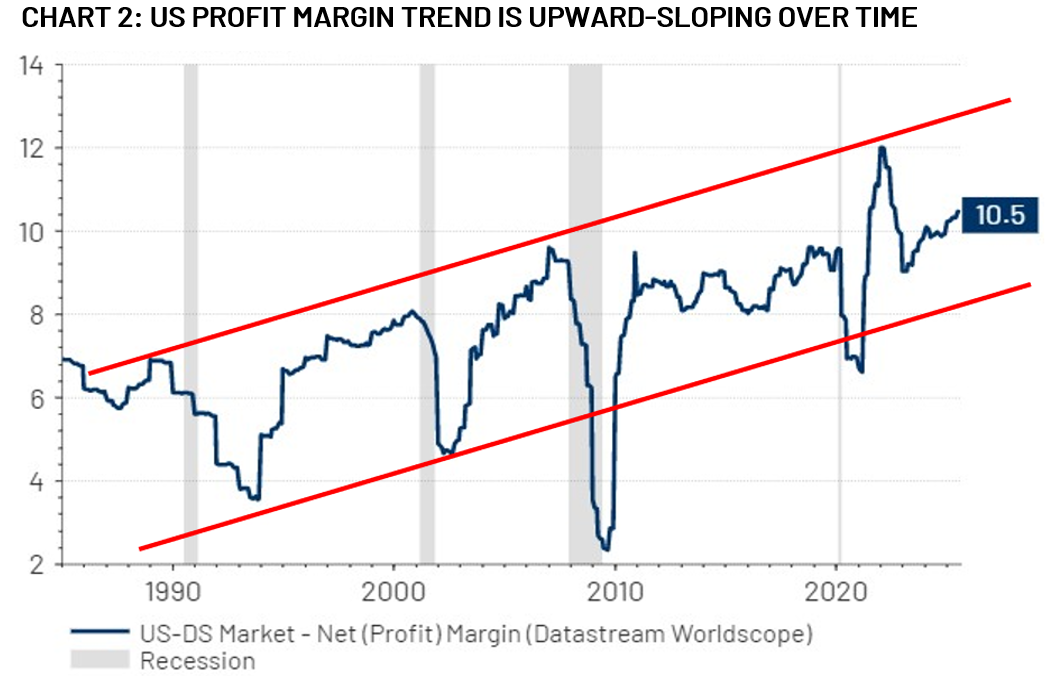
In particular, we believe the conversation around US large-cap profit margins (Chart 2, below) merits further exploration as it relates to valuation. Many believe that profit margins are ‘mean-reverting’ over time. Their argument is that while margins at times become elevated due to cyclical macroeconomic strength, this strong profitability will eventually ‘mean-revert’ back towards a long-run average. This is due to high margins getting competed away and/or degraded by a weakening economic cycle. However, we believe the actual data over the past four decades challenges this notion, as margins since the 1980s have actually displayed a distinct upward bias. While margins do exhibit some mean-reversion around economic cycles (see shaded recession bands in Chart 2, below), they appear to do so around an upward-sloping trend channel (see red lines on Chart 2) …suggesting profitability is growing structurally higher over time. Currently profit margins are in the middle of this upward channel, but still among the highest levels relative to history.
Historical Index Composition Matters for Valuation – Today’s Tech-Heavy Index is Higher Margin
Why do large-cap companies appear structurally more profitable today versus decades ago? We believe it has a lot to do with changes in the composition of the stock index itself over time. In 1985, when the profit margin data in our chart above begins, financial companies such as banks made up the single-largest sector in the S&P 500. Today, the technology sector is now by far the largest. Tech today represents around 34% of the index, rising to almost 43% when the tech-adjacent communication services sector is included. Strikingly, the top 10 largest stocks in the S&P 500 today– nine of which are technology or tech-related- represent about 39% of the index, almost twice the weight as the top 10 did in 1985, according to NDR Research.
This matters to index profit margins because properly scaled tech business models tend to have much higher margins than banks and other financial companies… or in fact the average S&P 500 company. This is particularly true for many of the largest tech companies, as their asset-light business models often lead to high cash flow growth… a topic we have previously touched on when discussing our preference for tech as an investment. Tech-related companies tend to trade at structurally higher valuations due to these robust growth and profitability characteristics…and thus, comparing valuation on the US large-cap stock index today relative to its history is less straightforward than it seems. As an aside, this stronger cash flow generation and growth is one of the reasons that RiverFront continues to favor mega-cap tech stocks as a secular growth theme.
Stock Valuation Relative to Bonds: Back to Pre- ‘Financial Repression’ Averages
Aside from comparing US stocks to their own history, in relative valuation terms, the picture is similarly nuanced. Currently, the S&P 500’s ‘earnings yield’ (the amount of corporate earnings divided by index price) after the multi-year stock rally is now roughly equal to the yield on 10-year Treasuries (Chart 3, below). Relative to the last 15 years, when earnings yields were meaningfully higher than Treasury yields, today’s condition of roughly equivalent earnings and bond yields (solid green line on Chart 3) could be viewed as ‘expensive’.
However, the unique feature of this most recent period is just how historically low inflation and interest rates were during this time. RiverFront refers to this peculiar era as ‘Financial Repression’, as it forced savers and anyone on a fixed income into taking more risk than they would otherwise feel comfortable doing given the lousy absolute returns available in low-risk bonds. In our opinion, the US officially exited the Financial Repression era in 2022 when the Federal Reserve started what would eventually be over 500 basis points of rate hikes during the subsequent year-and-a-half.
Viewed through a less recent historical lens, today’s yield differential for US stocks relative to bonds is right in line with the average level that relative earnings yields traded at during 1985-2007’s more ‘normal’ interest rate environment - before economic crisis and deflation risk allowed the Fed to engage in Financial Repression. Put another way, if we remain -as we expect - in a more normalized interest rate environment for the foreseeable future, stocks appear neither expensive nor cheap to us relative to interest rates today.
Conclusion: We Believe the US Stock Market is Not as ‘Overvalued’ as a Cursory Glance Would Suggest
To paraphrase famous investor Warren Buffett, ‘price’ is what you pay for an asset, but ‘value’ is what that asset is actually worth. While the concept of value is nuanced, multi-faceted and thus open to interpretation, we believe that the current price investors are paying for US stocks, while higher than average, represents reasonable value given the current fundamental and macroeconomic backdrop. Should our belief in this backdrop change, our views on valuation – and thus on our positioning – in US stocks would naturally change. Nonetheless, for the time being RiverFront balanced portfolios remain overweight US equities, with a particular emphasis on mega-cap, high free cash flow generating technology companies and themes.
Risk Discussion: All investments in securities, including the strategies discussed above, include a risk of loss of principal (invested amount) and any profits that have not been realized. Markets fluctuate substantially over time, and have experienced increased volatility in recent years due to global and domestic economic events. Performance of any investment is not guaranteed. In a rising interest rate environment, the value of fixed-income securities generally declines. Diversification does not guarantee a profit or protect against a loss. Investments in international and emerging markets securities include exposure to risks such as currency fluctuations, foreign taxes and regulations, and the potential for illiquid markets and political instability. Please see the end of this publication for more disclosures.
Download 08.26.2025 | Weekly View
Authored by
-

Chris Konstantinos CFA®
Managing Partner | Chief Investment Strategist