
Your choice regarding cookies: We use cookies when you use this Website. These may be 'session' cookies, meaning they delete themselves when you leave the Website, or 'persistent' cookies which do not delete themselves and help us recognize you when you return so we can provide a tailored service. However, you can block our usage by adjusting your browser settings to refuse cookies.
SUMMARY
- Leading indicators and government bonds are still forecasting recession…
- …but unemployment levels, construction spending, stock and credit markets are not.
- We think a mild recession in the next 6-9 months remains the most likely outcome.
A ‘recession’ is defined by the National Bureau of Economic Research (NBER) as a “significant decline in economic activity that is spread across the economy and lasts more than a few months”. Other economists define ‘recession’ more specifically, as representing two straight quarters of negative real (adjusted for inflation) GDP growth. Just as there is no one single definition of ‘recession’, there is similarly no one perfect way to predict it.
We once again revisit our ‘Recession Dashboard’, a list of indicators that we have found, in our experience, to be useful recession predictors. This is not an exhaustive list of what we track, and of course, no one indicator is infallible. However, taken in aggregate, we believe this provides a robust estimation of recession risks over the next 6-12 months. Shaded gray regions on the charts in this piece denote historical recessions as defined by NBER; each indicator we show has data back to at least the 1970s.
Our conclusion today – as it was back in January (see Weekly View 1/31/23) – is that the highest probability outcome is a mild recession sometime towards the back half of 2023 or early 2024. The conviction in our statement is higher today, as government bond signals and other leading economic indicators have weakened since January. We have also started seeing the early signs of a tightening of credit availability to smaller businesses. The looming US debt ceiling is yet another economic risk factor.
However, to paraphrase Winston Churchill, for us the ‘riddle wrapped in a mystery inside an enigma’ is that employment data remains so solid, and stock and credit markets – arguably the most reliable recession predictors - remain sanguine. Perhaps both messages are ‘right’ in that we are indeed heading for a recession, but just a mild one that allows for US corporate earnings to hold up … a theme we explored in more depth in our 2023 Outlook.

Treasury-to-Fed Funds Rate Differential: Negative - Inversion is Flashing a Warning Signal
The difference in yield between 10-year Treasury Note and Fed Funds (FF) yields has remained officially ‘inverted’ as 10-year yields are lower than short-term interest rates (see Chart 1, right). An inverted yield curve has historically been a reliable signal of impending recession, because falling long-term interest rates often mean bond investors expect some combination of lower future inflation and growth. When they fall below the levels set by the Federal Reserve, the bond market is suggesting the Fed has raised rates too much. After the curve inverts, a recession typically starts a year later, in our view. The yield curve has been inverted since November ’22, implying a formal ‘recession’ could start this upcoming winter or early next year. This signal has been a reliable but not perfect indicator for a half-century and as such must be taken seriously.

Labor Market: Positive - Employment Picture Remains Stable
Employment: Slowing employment trends can give important warning signals concerning the health of the economy. When employment growth falls below 1% (it's long-term trend), a recession often follows, in our view. Despite a surge in layoff headlines, payrolls are still growing above +2.5% year-over-year (Chart 2, right), down a little from January’s reading of 2.9%. There seems to be a structural shortage of workers and so any downturn in the labor market will be less than usual, in our view. Other employment-related signals we like to follow also remain in a constructive zone, in our opinion.

Consumer Confidence: Negative - Confidence Again Near Multi-Year Lows
The psyche of the US consumer is important, given that consumer spending represents nearly 70% of the US economy. A large drop in the difference between the Conference Board’s Consumer Expectations Index and the Present Situation Index usually precedes recession, but the lag times vary greatly. We believe it is most predictive at extremes, where it is today.
The improvement we witnessed from last summer to early this year has now dissipated, and this indicator remains well into recessionary territory, judging from history.

Construction Spending and Heavy Truck Sales: Positive - Still Growing, but Slowing
Construction plays an important role as a job creator across many industries and as a driver of demand for both natural resources and finished goods. Construction spending is growing at around 3.8+% as of March, down from 6.3% in January but still positive for future GDP growth if it can stabilize, in our view.
Heavy Truck Sales*: Another related data point is yearly heavy truck sales, which are running above 40k units/month – at the high end of its historical range - suggesting continued strong demand for goods and construction.
*Heavy trucks weigh over 26,000 pounds and include 18-wheeler tractors, cement mixers and city buses.
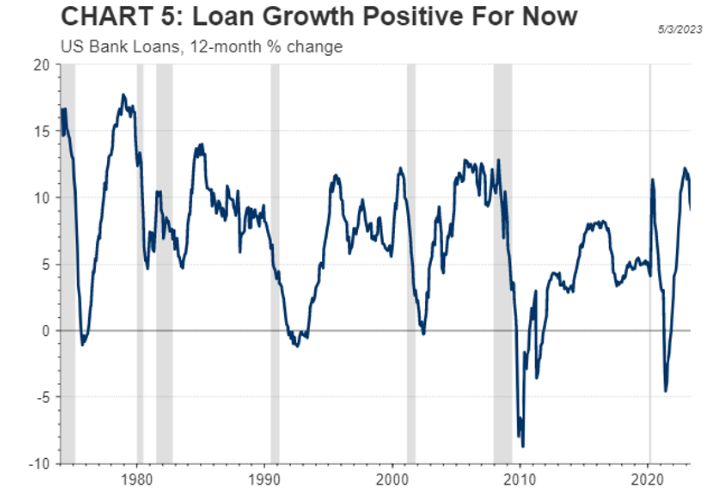
Lending: Mixed - Bank Loan Creation Still High, but Heading the Wrong Direction
Capital represents the ‘lifeblood’ for most businesses. Without access to capital, companies are unable to grow and may even need to restrict existing operations.
Bank loan creation grew at a historically strong year-over-year rate of almost 10% in April, slightly down from the levels we reported on in January. However, given the recent ‘mini crisis’ for regional lenders (see Weekly View 5/1/23), we expect the recent negative inflection in US bank loans to continue, at least for end markets such as commercial real estate and small business loans. The recent Senior Loan Officer Survey corroborated this inflection, as demand for Commercial & Industrial loans were down -53.3%, the second lowest level on record.

Leading Economic Indicators (LEI): Negative - Indicator Below Zero Since September 2022
The Conference Board’s ‘Leading Economic Indicators’ (LEI) is a predictive variable that is designed to anticipate turning points in the business cycle by roughly 7 months. The LEI is comprised of 10 indicators related to employment, business orders, residential housing demand, stock market prices and bond market credit conditions. The LEI has now fallen consistently for over a year, and is well below zero, which we typically associate with pre-recessionary conditions.
However, we would note that the recent Purchasing Manager Index (PMI) surveys tell a slightly different story. In those surveys, the S&P Global/Markit US manufacturing PMI is now slightly above 50 at 50.2. In addition, this indicator has now improved for the fourth straight month.
Conclusion:
As you can see from our selection of indicators, the more coincident indicators -- employment, construction and lending -suggest to us that the economy is quite healthy at the moment, but the more predictive indicators are negative. The enigma for us is that two major leading indicators for recessions –the stock and corporate bond markets - are not flashing a warning.
We think the best explanation for this enigma is that a backdrop of reasonable nominal growth, which includes the effect of rising prices, and a tight labor market can keep corporate earnings from deteriorating further, supporting stocks and corporate bonds. The highest probability outcome in our opinion is a mild recession sometime towards the back half of 2023 or early 2024. Given the mixed signals from our Recession Dashboard, RiverFront’s investment team remains roughly neutral in our stock-to-bond mix relative to our long-term strategic targets. Rather than large overweights or underweights to asset classes, we are focusing on security selection with an eye towards generating stable cash flow and income growth.
Risk Discussion: All investments in securities, including the strategies discussed above, include a risk of loss of principal (invested amount) and any profits that have not been realized. Markets fluctuate substantially over time, and have experienced increased volatility in recent years due to global and domestic economic events. Performance of any investment is not guaranteed. In a rising interest rate environment, the value of fixed-income securities generally declines. Diversification does not guarantee a profit or protect against a loss. Investments in international and emerging markets securities include exposure to risks such as currency fluctuations, foreign taxes and regulations, and the potential for illiquid markets and political instability. Please see the end of this publication for more disclosures.
Download 05.16.2023 | Weekly View
Authored by
-

Chris Konstantinos CFA®
Managing Partner | Chief Investment Strategist