
Your choice regarding cookies: We use cookies when you use this Website. These may be 'session' cookies, meaning they delete themselves when you leave the Website, or 'persistent' cookies which do not delete themselves and help us recognize you when you return so we can provide a tailored service. However, you can block our usage by adjusting your browser settings to refuse cookies.
SUMMARY
- Leading indicators and government bond market are forecasting recession…
- …but unemployment levels and loan growth are not.
- Mild recession late this year most likely, in our opinion.
A ‘recession’ is defined by the National Bureau of Economic Research (NBER) as a “significant decline in economic activity that is spread across the economy and lasts more than a few months”. Other economists define ‘recession’ more specifically, as representing two straight quarters of negative real (adjusted for inflation) GDP growth. Just as there is no one single definition of ‘recession’, there is similarly no one perfect way to predict it.
As the new year has dawned, we revisit our ‘Recession Dashboard’ that we first wrote about last summer, in order to give an update on where we believe we are with respect to recession risk in the US. This list of indicators below are ones that we have found in our experience to be useful recession predictors. This is not an exhaustive list of what we track, and of course, no one indicator is infallible. However, taken in aggregate, we believe this provides a robust estimation of recession risks over the next 6-12 months. Shaded regions on the charts in this piece denote historical recessions as defined by NBER; each indicator we show has data back to at least the 1970s.
Yield Curve: Negative - Inversion is Flashing a Warning Signal
The difference in yield between 10-year Treasury Note and Fed Funds (FF) yields -aka the 'yield curve'- has now officially ‘inverted’ as 10-year yields are lower than short-term interest rates (see chart, below). An inverted yield curve has historically been a reliable signal of impending recession, because falling long-term interest rates often mean bond investors expect some combination of lower future inflation and growth. When they fall below the levels set by the Federal Reserve, the bond market is suggesting the Fed has raised rates too much. After the curve inverts, a recession typically starts a year later, in our view. The yield curve has been inverted since November ’22, implying a formal ‘recession’ could start this upcoming winter or early next year (a view we shared in our 2023 Outlook).

As pundits are quick to point out, this signal has been a reliable indicator for a half-century and as such must be taken seriously. However, nothing has been normal about the US economy since the pandemic, so we must be open to the possibility that the efficacy of historically reliable indicators may be less so this time around. To this point, the Fed’s unusually heavy involvement in the Treasury market since the ’08 credit crisis may actually mean this signal has less significance this time around.

Change In Payrolls and Unemployment: Positive - Employment Picture Still Not Recessionary
Change in Payrolls: Slowing in employment trends can give important warning signals concerning the health of the economy. In our experience, a slowing of payroll growth at or below 1% tend to portend recession. Despite a surge in layoff headlines, payrolls are still growing above +3% year-over-year (chart, right).
Unemployment: Other employment-related signals we like to follow include the ‘Sahm Rule’, named after Fed economist Claudia Sahm, which is triggered when the three-month moving average of the national unemployment rate rises by at least 0.5% percentage points or more relative to its low during the previous 12 months. Similar to payrolls, this indicator also remains in a constructive zone in our opinion, with a change of only roughly 0.1% as of December.

Consumer Confidence: Mixed - Confidence in the Future Low, but Rebounding Since the Summer
The psyche of the US consumer is important, given that consumer spending represents nearly 70% of the US economy. A large drop in the difference between the Conference Board’s Consumer Expectations Index and the Present Situation Index usually precedes recession.
While this indicator remains near levels that have suggested recession in the past, it appears to us to be rebounding since its recent low last June.

Construction Spending and Heavy Truck Sales: Positive - Still Growing but at a Slightly Lower Rate
Construction Spending: Construction plays an important role as a job creator across many industries and as a driver of demand for both natural resources and finished goods. Despite recent housing weakness, construction spending is growing at around +8.5% as of the most recent data from November, down from nearly 12% last summer but still a positive for future GDP growth, in our view.
Heavy Truck Sales*: Another related data point is yearly heavy truck sales, which are running above 35k units/month – close to the high end of its historical range - suggesting a continued strong economy.
*Heavy trucks weigh over 26,000 pounds and include 18-wheeler tractors, cement mixers and city buses.
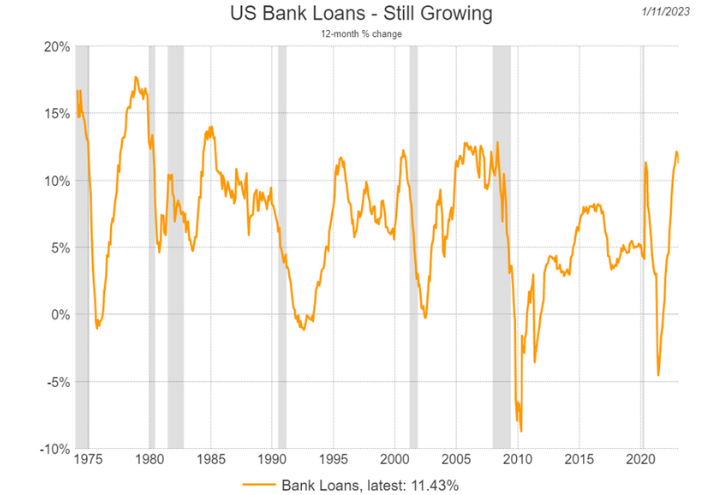
Lending: Positive - Bank Loan Creation Actually Strengthened Since the Summer
Capital represents the ‘lifeblood’ for most businesses. Without access to capital, companies are unable to grow and may even need to restrict existing operations.
Bank loan creation grew at a historically strong year-over-year rate above 10% in December, suggesting that companies still are both willing and able to access capital for growth initiatives, hiring and capital expenditures.

Leading Economic Indicators (LEI): Negative - Indicator Below Zero Since September
The Conference Board’s ‘Leading Economic Indicators’ (LEI) is a predictive variable that is designed to anticipate turning points in the business cycle by roughly 7 months. The LEI is comprised of 10 indicators related to employment, business orders, residential housing demand, stock market prices and bond market credit conditions. The LEI has now fallen for the 10th consecutive month and is well below zero, which we typically associate with pre-recessionary conditions.
The weakness for December was relatively widespread within the LEI’s various components, including manufacturing. However, we would note that the ‘flash’ Purchasing Manager Index (PMI) surveys released last Tuesday, tell a slightly different story. In those surveys, US manufacturing, while in contractionary territory, actually improved from November.
Conclusion:
While last June’s update generally gave the US economy a clean bill of health, many indicators have since deteriorated, leading us to place a higher probability of recession towards the back half of this year. However, this is not a ‘slam dunk’ prediction given that 3 of our 7 indicators are still positive. Perhaps both sets of indicators are ‘right’ and are signaling a recession… but a mild one given the relative health of the employment market and consumer and business balance sheets. This is a theme we explored in our 2023 Outlook.
While not formally part of our ‘Recession Dashboard’, it also bears noting that stock and credit markets themselves -often a leading indicator of recession historically – are not at recessionary levels. With the stock and corporate bond markets giving positive signals and government bonds flashing caution, financial markets are also sending mixed signals. Given these uncertainties and lower visibility into both the economy’s trajectory and Federal Reserve policy from here, Riverfront’s investment team entered the year relatively cautious in our positioning. We are actively looking for opportunities to deploy excess cash when we see the outlook improving.
Risk Discussion: All investments in securities, including the strategies discussed above, include a risk of loss of principal (invested amount) and any profits that have not been realized. Markets fluctuate substantially over time, and have experienced increased volatility in recent years due to global and domestic economic events. Performance of any investment is not guaranteed. In a rising interest rate environment, the value of fixed-income securities generally declines. Diversification does not guarantee a profit or protect against a loss. Investments in international and emerging markets securities include exposure to risks such as currency fluctuations, foreign taxes and regulations, and the potential for illiquid markets and political instability. Please see the end of this publication for more disclosures.
Download 01.31.2023 | Weekly View
Authored by
-

Chris Konstantinos CFA®
Managing Partner | Chief Investment Strategist