

Your choice regarding cookies: We use cookies when you use this Website. These may be 'session' cookies, meaning they delete themselves when you leave the Website, or 'persistent' cookies which do not delete themselves and help us recognize you when you return so we can provide a tailored service. However, you can block our usage by adjusting your browser settings to refuse cookies.
Looking Ahead: RiverFront's Long-term Forecasts for Stocks and Bonds
SUMMARY
- Strong recent market returns suggest to us lower forward return assumptions in our base case… but stocks still offer superior return potential to bonds
- We think low inflation holds the key to the market’s ability to sustain above-average valuations
- International equities offer slightly better potential long-term returns versus US, in our view
Today we continue in our tradition of publishing annual long-range forecasts for global equity markets. But before we dive into our review of where we think markets may be headed longer-term, we wanted to provide a retrospective of what we’ve learned in our more than two decades of studying the effects of price mean reversion on future returns, both here at RiverFront Investment Group and at a predecessor firm where many of our investment team previously worked together.
“Every plan is a good one - until the first shot is fired”
- Carl Von Clausewitz
The ‘Science’
It is often said that asset management is as much an art as a science. We concur - hence our tagline here at RiverFront is ‘The Art and Science of Dynamic Investing.’ We believe that the prime determinant of long-term returns tends to be the price you pay for an asset at the outset of your investment – the mathematical ‘science’ of asset valuation, if you will. We believe the distance above or below a persistent long-term trend line can give investors powerful clues into future returns, especially at extremes. We call this concept Price Matters®. This power of ‘mean reversion’ works in investors’ favor especially when markets are significantly below trend…and against the investor buying into markets trading well above trend. We also believe that this signal explains more of an investor’s return the longer applicable investment time horizon. A 2020 Goldman Sachs paper suggests that starting valuation has explained roughly 50% of US 10-year forward returns historically, going back to the 1930s.1
The ‘Art’
If starting price accounts for roughly half of forward returns, some of the remaining 50% we believe comes from the ‘art’. The ‘art’ for us in part comes in adjusting the science to the regime we find ourselves in, understanding business cycles, and making judgments about current fundamental trends. We also place significant emphasis on investor sentiment and price momentum, explicitly building both into our asset allocation process. In order for a client to be emotionally able to commit to remain in markets long enough for mean reversion to work, we think it requires a flexible asset allocation – not a ‘set and forget’ methodology. While on paper one might end up with a similar long-term return with ‘set and forget’ vs. a dynamic approach, we believe the path the market takes to get those returns plays a big role in whether or not someone actually sticks to the agreed-upon allocation.
The ‘art’ also comes in adjusting for human behavior patterns. This is a simple recognition of the emotional impact of greed…and especially fear. While buying low and selling high make logical sense, in practice humans are emotionally wired to do the opposite in our experience, abandoning their long-term plan in moments of extreme stress. This is a psychological problem with important practical implications; the compounding effect of stock price appreciation and dividend payments can’t work in your favor if you’re not invested.
In order to combat this, we engage in active risk management, which we believe creates ‘emotional alpha’. We define emotional alpha as the value of helping a client navigate market swings without making decisions purely on emotion. Emotional alpha is what keeps an investor invested and reduces the risk that they give up on their plan at the worst time. For more on the concept of emotional alpha, see here.
This is why we believe in a dynamic asset allocation discipline which recognizes the importance of long-term value but also allows for the possibility of unforeseen events, with defined processes to navigate them – our ‘tactical’ shifts. We think our approach is especially important for clients who have an investment horizon of seven years or less...which describes many of the clients we work with.
Two Decades of Price Matters®: What We’ve Learned
Two of our core values here at RiverFront are ‘humility’ and ‘accountability’. These values have instilled in our investment team a culture of continuous improvement, whereby we constantly evaluate our investment processes and explore whether there is a more effective way to do things. The ultra-low interest rate environment and the surge in money printing across the globe appear to have impacted the efficacy of traditional valuation measures. As a result, we have been regularly reevaluating and adjusting our processes for this environment.
In analyzing the biggest asset allocation decision – stocks vs. bonds - we believe Price Matters® has remained a very useful barometer in this era of ‘financial repression’. It has given us invaluable feedback about the continuing attractiveness of stocks relative to bonds in a decade-plus that has incorporated acute periods of stress, including a global financial crisis, the Euro crisis, the ‘Taper Tantrum’, Brexit, and, most recently, the deadliest global pandemic in a century.

However, another learning from the last decade is that a historical ‘regime’ – as defined by inflation and interest rates –can have a major impact on the speed and magnitude of mean reversion. The massive pandemic-fueled fiscal spending that is now accompanying the monetary easing is only exacerbating the distortion. Consequently, over the last few years we have chosen to apply a lower weighting to our Price Matters® inputs in our asset allocation modelling for shorter-to-intermediate term time frame investing. We see parallels to the 1950s-1960s, where our Price Matters® work suggested stocks were overvalued…yet they stayed above trend until the early 1970s, providing above-average returns for stocks during this period (see chart, green oval). For more on Lessons from Price Matters, see here.
Mean reversion’s ‘Achilles Heel’ comes if one continues to use a trend that is no longer valid and so we believe it is important that our team is constantly working to validate trends via fundamental analysis. The concept of reversion to a mean hinges on a belief that the trend will continue unabated into the future. This is why we have higher conviction in Price Matters® conclusions in areas such as the United States, where we have a century’s worth of data from which to study the trend. We place less emphasis on mean reversion as a valuation technique in areas such as emerging markets, where data goes back less than 40 years and is marked by significant ‘regime shifts’ in growth. We also have learned that some countries – such as Japan – do not exhibit strong mean reversion historically, rendering this type of valuation work less useful both in absolute terms and with regards to comparing two different regions of the world. For more on this topic, see our 2020 Strategic Review here.
Our conclusion is that Price Matters® and other deep-value based asset allocation methods remain a good framework for thinking through the big picture – especially the stock-vs bond question - but requires augmentation from an ‘ensemble’ of other strategic analysis of regimes, macro drivers, and momentum processes to be more effective for time horizon investing in periods of roughly seven years or less.
2021 Long-Term Equity Capital Market Assumptions
- Strong recent market returns suggest to us lower forward return assumptions in our base case scenario… but stocks still offer superior return potential to bonds, in our view
- We think low inflation holds the key to the market’s ability to sustain above-average valuations
- International equities offer slightly better potential long-term returns versus US, in our view
We believe that strong gains in the stock market, when starting from above-average valuations, can potentially drag future returns forward to the present. This informs our view of what major stock markets can achieve in the next 5 to 7 years. Also informing our views are our assumptions about inflation, interest rates and the likelihood that 2021 is the beginning of a prolonged global economic expansion.

Despite a tumultuous year for the economy, equities were surprisingly resilient in 2020 after a stellar 2019. Stocks experienced strong total returns in the US and emerging markets, with lower but positive returns also found in developed international. Likewise, high yield bonds and other credit instruments saw spreads tighten as access to capital was plentiful and interest rates remained low with the Federal Reserve staying supportive. As such, major equity asset classes appear less attractive on an absolute basis than they were a year ago (see changes in Price Matters® Distance From Trend table over the last 12 months), but still look attractive relative to traditional fixed income, in our opinion.
At RiverFront, we believe in ‘process over prediction’. This is the idea that a dynamic investment process built to adapt to unexpected events is more important to long-term investment success than anchoring on any particular forecast. Nonetheless, we view long-range capital market forecasts as a part of our process to help identify and monitor what we believe to be important long-term drivers for markets.
We think our ‘ensemble’ approach – whereby we combine our view of mean-reversion effects on valuation with our team’s collective macro views – is the most pragmatic way to generate a range of long-term return estimates for asset classes that are appropriate for the current environment. In order to aid asset allocators, we take these forecasts and apply them to asset allocation targets by investor time horizon, in order to come up with a range of forecasted returns for various models under bear, base, and bull scenarios.

Inflation Holds the Key to our Long-Range Scenarios
The current bull market in stocks is based on a foundation of very low interest rates and contained inflation expectations. Investors with a longer time horizon now have little choice but to buy stocks or live with the low returns from cash and bonds. Since the Great Recession of 2008, the world’s central banks have tried to boost aggregate demand with aggressive monetary policy; lowering short-term interest rates to zero and then buying longer-term bonds to drive long rates down as well. This has certainly helped the prices of stocks, bonds, and real estate…but has not yet been a catalyst for a boom in consumer spending or capital investiture by companies, nor has it generated above-average inflation across the decade.
More recently, it seems that the two stimulus packages enacted in 2020 merely helped to offset the tremendous economic damage inflicted by COVID-19. As the global economy recovers, however, the backdrop for inflation has changed. We think it is likely that the latest package of some $1.9 trillion will enter an economy that is now recovering quite rapidly. The combined amount of fiscal and monetary stimulus for 2020 and 2021 will be around $9 trillion. To put this in perspective, the US was a $21 trillion economy pre COVID-19, and during 2020 economic activity declined roughly $2 trillion from peak to trough. Frankly, this is the largest set of government spending programs in history, financed by the largest monetary expansion in history.
For the US, the question now is whether an accommodative Fed combined with huge fiscal spending will finally do what monetary policy alone could not: reignite the economy and usher in a return to above-average levels of inflation. To understand how this may affect the stock market, we must first try and understand why our decade-long experiment with monetary policy hasn’t created massive inflation thus far.
Where Has Inflation Gone?
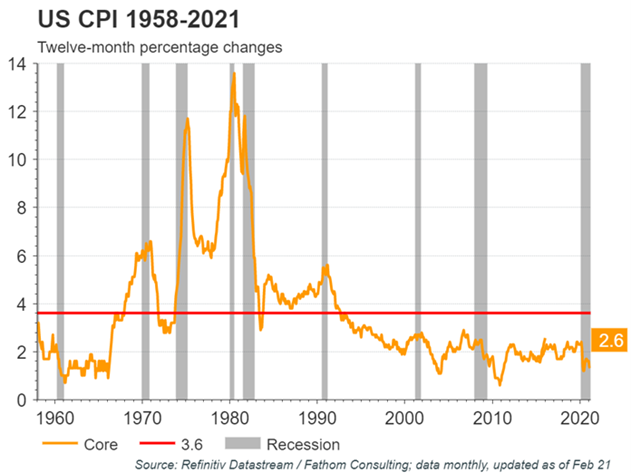
When central banks first started ‘printing money’ in 2008, some feared that it would inevitably lead to high inflation, but it hasn’t so far. In the US, Core CPI has grown an average of 3.6% year-over-year since 1958, but only roughly 2% over the last couple of decades, including lower than 2% since 2008. (Core CPI is the Consumer Price Index for All Urban Consumers: All Items Less Food & Energy). In our base and bull case scenarios for stocks, US inflation trends above this recent range over the next seven years but stays contained below the long-term average of 3.6% (see red line on chart, left).
Why We Believe Inflation Hasn’t Come Back Yet
We believe that structural disinflation has been in large part a function of structural oversupply. Cheap labor (via globalization), productivity-enhancing technologies, and a glut of commodities (via advances in energy extraction and food production) are a few examples of this oversupply. The impact of this oversupply has been a ‘benign’ form of disinflation that tend to benefit consumer-driven economies. In addition, we note that the developed world is aging – particularly in the large population centers of Europe and North Asia. We believe an aging global society tends to spend less and save more, in our opinion another structural disinflationary force.

Can This Benign Inflationary Environment Persist?
Many of these structural disinflationary forces are still in effect to varying degrees, in our view. Thus, the relatively sanguine view of inflation over our forecast horizon - as espoused in our base and bull cases - could persist. The US has benefited disproportionately from a technology-driven productivity boost over the last decade (see chart, right). In our view, these disinflationary forces are also due to a structural oversupply of energy commodities, as well as our belief that the world’s labor and goods markets will continue to be generally ‘open for trade’ despite recent tariff-based strategies invoked by the US and friction between the UK and the European Union in the aftermath of the UK leaving the European Union. Furthermore, we think additional disinflationary forces through digitization have been brought forward significantly by the pandemic.
The Relationship Between Inflation and The Stock Market
A little inflation is a good thing for economic growth and corporate profits…one of the reasons why the Fed officially targets around 2% inflation. However, too much inflation is detrimental to the economy as well as share prices. As inflation rises, input costs for companies and goods prices for consumers rise, sapping profits. Rising inflation also drives up interest rates, and with them the cost of taking on new debt – a ‘tax’ on corporate and personal balance sheets. In times of meaningfully rising rates, yields on stock earnings and dividends appear less attractive to investors relative to bond yields. In this scenario, stock prices often fall until yields on stocks appear more competitive again.
We believe stocks would be very sensitive to the higher rate ranges, causing prices to decline and perhaps go through a bear market, which to us represents a decline of more than 20% over several months. Because we think the Fed is quite capable of using its policy tools to prevent sustained inflation, we do not see a repeat of the 1970s (a decade where inflation peaked at 13%) and so still expect stocks to be higher over a roughly seven-year time frame, but the journey would be more uncomfortable and the gains much more modest.
Under our base case scenario, corporate earnings will likely experience stable growth and stock valuations will be able to remain above-trend, albeit with some periodic inflationary scares. These inflationary episodes may create volatility – and thus periodic ‘buying opportunities’ - in the stock market but we believe will prove unfounded, allowing stock prices to rebound. However, in our bear case scenario, inflation manages to consistently trend higher than this range, forcing the Fed and other central banks to raise rates faster and more dramatically than expected.
Rate Hikes – A Question of When, Not If…
Extremely low interest rates are unlikely to last forever. We anticipate the Fed tightening their monetary policy at some point over our long-term forecast horizon. The degree of, and reason for, higher interest rates affect our forecasts and depend on the following questions:
- WHY: The reason that rates rise matters. If rates rise over time primarily due to improved economic growth, corporate earnings can outpace valuation contraction and stocks can do well. However, if economic growth remains stagnant, earnings may not grow enough to offset falling valuations and stocks may struggle.
- WHEN: The later rates are hiked, the better for stocks. The bond market still believes the Fed will start hiking rates at some point in 2022, judging by current Fed Funds futures analysis. In our opinion, this contradicts the Fed’s own recent minutes and ‘dot plot’ that suggest hikes may not commence until close to 2024. Our view is closer to the latter than the former, commensurate with the Fed’s recent language expressing comfort with ‘overshooting’ their inflation target in the near term. Whether rate hikes occur in 2022, 2023, or 2024 will have a meaningful impact on stock prices across our forecast horizon, in our view.
- HOW HIGH: How far rates will ultimate rise in this cycle will also have a major effect on stock prices. In our various scenarios, the terminal (ending) 10-year treasury yield ends up between 4.0-4.5% but averages less than 3% over much of the 7-year horizon in our base and bull cases. In our bear case, inflation stubbornly persists over 3% even with below-trend economic growth, causing rates to spike earlier in the horizon before dropping with the onset of US recession. This dynamic would cause valuation multiples on stocks to drop well below current levels, in our view.
The path of interest rates over the next seven years will also greatly impact fixed income returns. When looking at the Bloomberg Barclay’s Aggregate Bond Index (‘Aggregate’), we had to make several assumptions to make a forecast. We started by forecasting the yield of 10-year Treasury Notes, incorporating both the guidance from the Fed and the message of the markets. This forecast brought us to the conclusion of a 4% yield as the base case, comprised of a 1.7% ‘real’ (adjusted for inflation) yield as growth prospects would have improved and the Fed would likely have reached its 2% sustainable inflation target if they do not raise rates until 2023.
From there we forecasted the returns of corporate bonds, agency bonds, and mortgage-backed securities to arrive at a forecast for the Barclays Aggregate Bond index. We believe that the Aggregate will have a similar trajectory to the 10-year as it pertains to total return. Currently, the Aggregate yields approximately 10 basis points (one tenth of one percent) less than the 10-year and we do not expect any further spread tightening. In our base case scenario, we see the Aggregate yields rising roughly 240 basis points over the seven years. While there will price depreciation during this period, the income component will outstrip the price loss and thus provide a positive return of roughly 1.6% per annum, in our view.
Due to the unprecedented nature of what is occurring, our three macro scenarios incorporate three different views of how inflation will manifest itself – why, when and to what extent – and how markets will respond.

BASE CASE: Continuation of steady growth after stimulus, inflation higher but range bound
Our Views on Economic Growth-Base Case:
- Reasonable economic growth with relatively low inflation will lead to both above-average valuations and stable earnings growth, though stock multiples will come down from current levels.
- US remains the economic gold standard; USD manages to keep its ‘reserve currency’ status while slightly weakening under the strain of large deficits and improving global growth.
- European and Japanese growth accelerates over next 12-18 months but then slows to prior levels as structural issues (tight labor laws and significant regulation) remain unresolved.
- China and the US enter a new ‘Cold War’; China’s economic growth averages 4-6% (down substantially from 2001-2011 levels), generated increasingly from internal consumer demand.
Our Views on Reform, Taxes, and Margins-Base Case:
- Globalization trends remain status-quo: outsourcing of labor and production neither makes new inroads nor materially deteriorates.
- Protectionism doesn’t get worse from 2019 nadir; China and US trade choppy, but US increasingly trades with rest of Asia/Mexico to fill void.
- Corporate America learns to make do with higher structural corporate tax rate starting in 2023; they protect margins by driving efficiency and hiring less workers; margin trend roughly flat.
- Europe makes some inroads towards debt mutualization, but political process remains ‘two steps forward, one and half steps back’ as Brexit and perceptions of European Union overreach complicate relations.
- Japanese Prime Minister Yoshihide Suga continues ‘Abenomics’ policies, along with more fiscal stimulus.
Our Views on Valuation and Earnings-Base Case:
- Global stocks’ earnings and valuations mean-revert some as their economies heal, but earnings growth more than offsets multiple contraction; international multiples compress less than US.
- European and Japanese earnings similar to US at first due to global reflation and outsized exposure to emerging markets, but then slows down to prior levels due to worse demographic challenges and lack of labor reform.

BULL CASE: ‘Melt-up’ due to ‘TINA’ (There Is No Alternative to stocks).
Our Views on Economic Growth- Bull Case:
- Our ‘dare-to-dream’ bull case involves a similar economic picture to the base case, but with short and long-term interest rates remaining below inflation for longer.
- Stocks trade at higher valuations as investors pay up for stocks as the only choice for above-inflation returns. Our bull case assumes above-average valuations remain in place generally for the duration of our forecast.
- The Fed is able to engineer a well-telegraphed ‘taper’ in 2023, while the US and global economy is still in recovery mode. Ensuing market volatility does not set off a prolonged bear market in stocks, nor a deep recession.
Our Views on Reform, Taxes, and Margins- Bull Case:
- In this scenario ‘globalization’ is not dead. A closely divided Senate keeps additional trade regulations ‘in check’ and would likely support ‘smart globalization’ where companies still outsource but become less dependent on China.
- Corporate tax hikes appear early in the forecast period and are less punitive than some fear.
- Real reform of Europe’s financial system improves Europe’s bank balance sheets. This restores an enthusiasm to lend; an upward sloping yield curve (long rates higher than short) increases profits and profit margins. Pan-European Bonds backed by policymakers allows for lower borrowing costs for all countries, and the region’s embrace of more flexible labor policies allow for greater innovation and entrepreneurship.
- Structural reform under Prime Minister Suga and Liberal Democratic Party (LDP) leadership in Japan continues to improve profit margins.
Our Views on Valuation and Earnings- Bull Case:
- US price-to-trend earnings multiple contracts only modestly (or even expands) as ‘Goldilocks’ (not too strong, not too weak) economic and rate environment persists. US corporate earnings grow at an above-average rate.
- Europe outperforms the US as the ‘Euro experiment’ finally reaches fruition with true currency union after over two decades of trial and error.
- Japan: Outperforms the US in local terms, yen weakens; Japan benefits from global boost in capital goods and automation spending, experiences margin expansion with further labor and governance reform.
- Emerging markets enjoys the best returns of any asset class as growth is robust, earnings growth outpaces developed economies, inflation is relatively tame, and currencies are stable to higher given commodity price reflation.

BEAR CASE: INFLATION RETURNS. Inflation scares cause a bear market; stocks end the period higher, but with well below-average returns.
Our Views on Economic Growth-Bear Case:
- Our bear case involves a persistent upside surprise in inflation in the US and UK as a result of massive, unprecedented stimulus and post-COVID-19 supply shocks.
- Inflation proves itself structural and remains stubbornly above the averages of the prior twenty years, declining only upon onset of recession.
- Bond investors build in a risk premium and 10-year yields rise as the Fed is forced to halt bond-buying, shrink its balance sheet, and raise short-term interest rates.
- Real growth is lower due to higher inflation, which leads to a recession in the US and emerging markets (ex-China) as the Fed is forced to raise interest rates.
- Stocks fall 20-40% in response to a significant rise in long-and short-term interest rates before beginning a new cyclical bull market as inflation and rates come back down.
- By the end of our time horizon, inflation drops, and 10-year interest rates return to a 3.5% range; Stock returns are well below average due to a decline in valuations and the time it takes to recover from the bear market.
Our Views on Reform, Taxes, and Margins-Bear Case:
- A sustained rise in corporate and personal tax rates in the US to levels not seen in the past three decades sap earnings power and dampen consumer sentiment.
- An environment of de-globalization, antitrust actions against major technology companies, and a backward move in supply-side reform in both Europe and Japan lead to lower profits and investor caution. US protectionist leanings persists in trade; all of Asia suffers.
- Europe falls back into 2011-style political squabbling and constant mini-crisis; no attempt at debt mutualization, bank balance sheets remain constrained, leading to very little lending to the real economy.
- Japanese political landscape marred by inaction and a succession of short-tenured prime ministers.
Our Views on Valuation and Earnings-Bear Case:
- US earnings average well below trend as both top and bottom line suffers from slow growth, a high inflation backdrop and higher taxes.
- European earnings remain moribund after a brief cyclical rebound early in our forecast horizon.
- Japan earnings suffer as Yen strength chokes export economy; underperforms the US in local terms, but slightly better in USD terms as yen rises.
- Emerging markets fares the worst as higher US interest rates results in a deeper bear market. Higher rates in US increases systemic risk across emerging markets, causing major multiple contraction.
Conclusion
Our forecasts are an admission that the strong returns in both stocks and bonds over the past 10 years have likely limited the potential long-term forward return of balanced portfolios to well below historical averages. This is both an investment and a communication challenge for asset allocators, but one that we feel is best addressed proactively – as the saying goes, ‘hope is not a strategy’. We believe the following disciplines will be crucial to deploy for asset allocators given the current backdrop:
- Dynamic asset allocation: The flexibility to move up and down asset allocations quickly as the fundamental backdrop changes
- Active risk management: deal with potential increases in stock and bond volatility
- The willingness and ability to seek alternative sources of return and income
- ‘Process over prediction’: the willingness to shift strategies in a calm and disciplined way as unexpected events change
- Transparency and communication: Emotional alpha will be maximized in an environment where the investor and asset manager are in a healthy relationship of trust and two-way communication
At RiverFront, we are facing this challenge clear-eyed and calm. While we believe building prediction engines are important, we also believe building an unemotional, adaptable discipline that is consistently applied gives investors the best chance of long-term success. Our tactical and risk management disciplines are designed to adapt in real time both to positive and negative developments.
Download 04.28.2021 | Strategic View
Authored by
-

Chris Konstantinos CFA®
Managing Partner | Chief Investment Strategist
-
Rod Smyth
Vice Chairman