
Your choice regarding cookies: We use cookies when you use this Website. These may be 'session' cookies, meaning they delete themselves when you leave the Website, or 'persistent' cookies which do not delete themselves and help us recognize you when you return so we can provide a tailored service. However, you can block our usage by adjusting your browser settings to refuse cookies.

2022 Outlook Summary: 'Riding the Recovery'
SUMMARY
- In our Base Case, we believe US stocks generate positive returns in ‘22 but with more volatility.
- We start the year overweight US equities and underweight fixed income.
- The largest market risk we see is interest rates rising faster than we forecast.
Riverfront is proud to release our 2022 Outlook, entitled ‘Riding the Recovery’. Our Outlook is a visual chart pack designed to walk investors through our investment views and predictions for the upcoming year. In today’s Weekly View, we created a concise synopsis of the Outlook’s conclusions, along with four selected visuals that encapsulate a number of key takeaways. NOTE: Investors should contact your financial advisor to request a copy of the Outlook 2022.
We liken stock investing in 2022 to the experience of riding a mechanical bull; more controlled than it seems, and ultimately rewarding… but not without its share of white-knuckle moments. In our Base Case scenario (see table below), we foresee 2022 as another bull market for stocks, but caution investors that overall returns for stocks are likely to be lower than in the last 12 months, and volatility likely to be higher. We start the year overweight US equities and underweight fixed income. We also see some selected opportunities overseas, preferring developed markets to emerging ones. While we are bullish on stocks, we recognize that interest rates rising faster and higher than we foresee are perhaps the biggest risks facing the market.
2022 Outlook

2022 CATALYSTS, RISKS AND KEY DRIVERS: “The I’s Have It’
Positive catalysts we see for 2022 include solid earnings growth, relatively low interest rates, and capital shifting from bond to stock allocations. The biggest risk we see for stocks is not another pandemic-led economic shutdown, but rather interest rates rising faster than we are expecting, placing downward pressure on stock market valuations.
Key drivers we are watching closely include inflation expectations, interest rates, and the continued innovation within the US economy and corporate sector. In addition, the way that interest rates historically interact with stock market valuation informs our view of the intrinsic value of equities. We call these key drivers the 'Four I’s' and view them as worthy of more in-depth analysis; each has its own section in our Outlook.
INTRINSIC VALUE: Stocks Are Pricey Relative to History, But Reasonable Relative to Rates
While stocks are expensive relative to history, we think they remain reasonably valued relative to interest rates. The difference between the expected earnings yield on the S&P 500 on 12 month-forward earnings and the yield on the 10-year Treasury Note— the equity risk premium — is +3.2 percentage points as of quarter-end (green line).
Dividend yields are also slightly greater than treasury yields (blue line), suggesting equities provide attractive income potential over ‘risk- free’ alternatives.
These lines are high relative to history, suggesting to us that stocks are still reasonably valued — particularly compared to the peak- market times of the late 1990s or mid-2000s.
Earnings and Dividend Yields Versus Bond Yields

INNOVATION: Technological Productivity Continues to Power US Economy and Corporate Earnings
As measured by Gross Domestic Product (GDP), the US economy has eclipsed its pre-pandemic high output. Even more impressively, US corporate profits are now 37% above its pre-pandemic high.
In contrast, other similar developed world economies such as the Eurozone and Japan have yet to reach their pre-pandemic heights in economic output.
US GDP and Corporate Profits

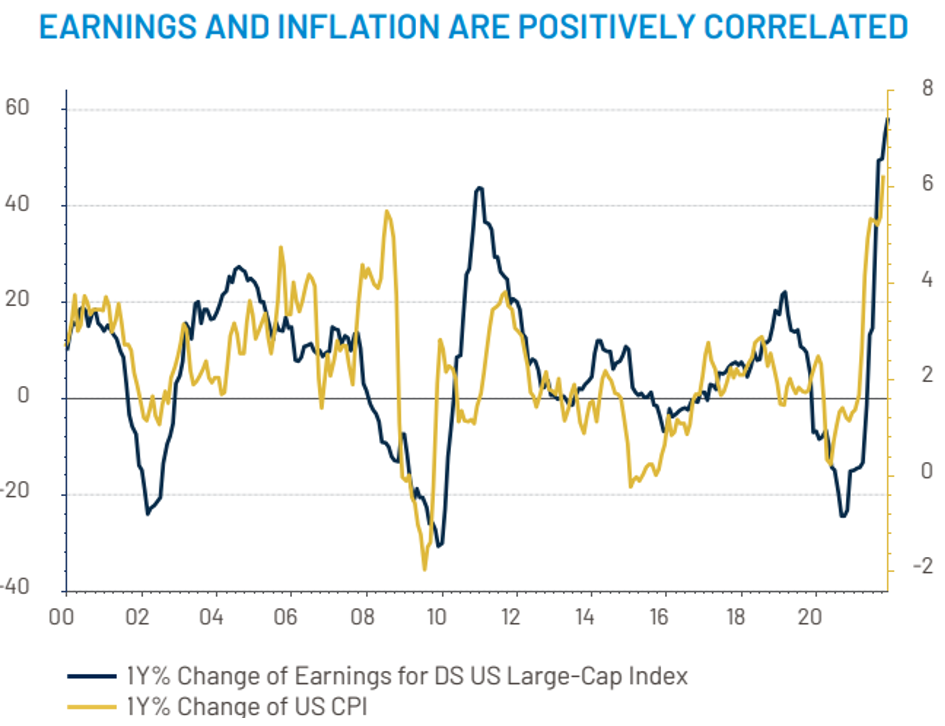
INFLATION: A Little Bit of Inflation May Be Good for Stocks
There is concern about inflation’s potential to damage stocks by hurting corporate margins and thus earnings per share (EPS) growth. However, there is some evidence to suggest that higher consumer inflation corresponds to stronger corporate earnings, not weaker. Our own internal research suggests that changes in CPI actually have a strong positive correlation to changes in US large-cap stock earnings.
As long as inflation is a result of strong economic growth – as is the case currently – we think stocks can shake off mildly higher inflation.
Earnings and Inflation are Positively Correlated
INTEREST RATES: Stock Market Can Endure Initial Rate Hikes
The Fed is likely to begin to hike interest rates at some point in 2022. According to a study by Ned Davis Research, across the last sixteen rate hike cycles starting in 1946, US stock gains have averaged +5.1% and +4.3% respectively in the first and second years of a Fed rate tightening cycle.
More recent results have been better. Over the last thirty years, the market has averaged +12.8% in the year after the first rate hike (see red dots on chart). Stocks can produce positive returns during hike cycles, as long as rates are rising due to economic growth…and that rate increases are gradual.
S&P 500 Index Around First Rate Hikes: 1992-2016

Download 12.20.2021 | Weekly View
Authored by
-

Chris Konstantinos CFA®
Managing Partner | Chief Investment Strategist