
Your choice regarding cookies: We use cookies when you use this Website. These may be 'session' cookies, meaning they delete themselves when you leave the Website, or 'persistent' cookies which do not delete themselves and help us recognize you when you return so we can provide a tailored service. However, you can block our usage by adjusting your browser settings to refuse cookies.
Global markets entered a surreal phase this past week, as falling oil prices delivered a sucker punch to an already-shaky investor sentiment and policymakers’ response to the COVID-19 threat underwhelmed. Meanwhile, the health crisis hit home for many Americans as schools and spectator events were cancelled and Europe went on complete lockdown.
The market result was vertigo-inducing: five straight days of more than 4% swings in either direction as the US market officially entered ‘bear’ territory, defined as more than a 20% peak-to-trough move since the all-time high less than a month ago. Thursday marked the single worst day in history for the global stock market, with the MSCI All-Country World Index dropping -9.8%. This was followed on Friday by a late surge after the Trump administration accessed $50 billion in funding and vowed to bring a bipartisan relief bill, erasing a good portion of Thursday’s historic drop.
With volatility at its highest levels since 2008, investors are understandably dizzy and exhausted. In times like this, it’s important to take a step back and focus on what we think we know at this stage.
- Distortions of Panic Selling: Unfortunately, we may be back to the “Phase 2” of the market selling cycle that we described in last week’s Weekly View – “Indiscriminate Selling” – whereby investors panic and throw whatever they can overboard. The swiftness with which our key technical levels of 2750 and 2595 on the S&P 500 were violated last week may suggest the potential for a longer, deeper market correction that may need multiple retests and even potentially lower lows before putting in a solid bottom. Our risk management disciplines remain on alert given the current technical backdrop of the market, particularly in our shorter-horizon portfolios.
- Beware the Crowd at Extremes: Near-term market sentiment reached pessimistic extremes even before Thursday’s price action, based on data such as Ned Davis’ Crowd Sentiment Poll (source: NDR, data as of 3/11/20). Other technical data such as the put/call ratio and the VIX are also close to historic extremes. All of this suggested to us at least some sort of near-term bounce from Thursday’s low was likely…the quality of which we will have to judge in real time to determine its staying power. Friday’s massive rally is a good start, but may not be an indication of a solid bottom. Especially as this Monday’s open looks like another rough start to the week, with futures suggesting another limit down (-5%) as of the time of writing (Sunday night).

- ‘Judge the quality of the bounce’: This is a phrase we use a lot around RiverFront’s HQ when evaluating the technical backdrop of markets. We believe that when key technical support levels are breached in a market selloff, they then become a psychological ceiling for markets. Thus, we would like to see the S&P 500 be able to hold 2595 (orange line, on chart right) and ideally also 2750 (green line, the June 2019 low) on the upside before starting to consider the bottoming process to be in full swing. 2870 may also prove to be tough resistance on the upside. Its’ worth remembering that market bottoms are generally a process, not an event; often times, markets retest or even make new lows before the bottom is solidified. On the downside, we are now watching 2350 (red horizontal line, the December 2018 low) as the next major level of support, should 2595 fail.

What is the stock market currently pricing in for the economy? Our probability of a US recession in 2020 has risen meaningfully from our Outlook 2020 at the end of December, with very little forward visibility given the fluidity of travel bans and business closings. We believe this distinction matters because, according to Ned Davis Research analysis (chart right), market corrections that aren’t accompanied shortly thereafter by recession tend to be shorter and shallower. While the US economy is likely to contract in Q2, it’s possible the market may look through the dislocation as transitory if the virus threat appears to be receding by the summer.
How Is Riverfront Managing Through This Volatility?
Given the lack of visibility into the impact on the economy at this stage, all RiverFront Asset Allocation portfolios have taken various levels of de-risking action over the past couple of weeks, as per our risk management discipline. We are now underweight stocks and overweight cash relative to our benchmarks in all of our Advantage balanced portfolios, and meaningfully underweight international stocks in particular.
We believe the US economy is entering this health crisis in solid shape, suggesting to us that the US is better positioned to weather this near-term storm than many of our international peers. Thus, we have chosen to concentrate the predominance of our equity sales in international stocks.
Take A Deep Breath
….in a week like what we all just experienced, it’s difficult to keep your wits about you. However, a couple counterpoints to focus on when everything seems hopeless:
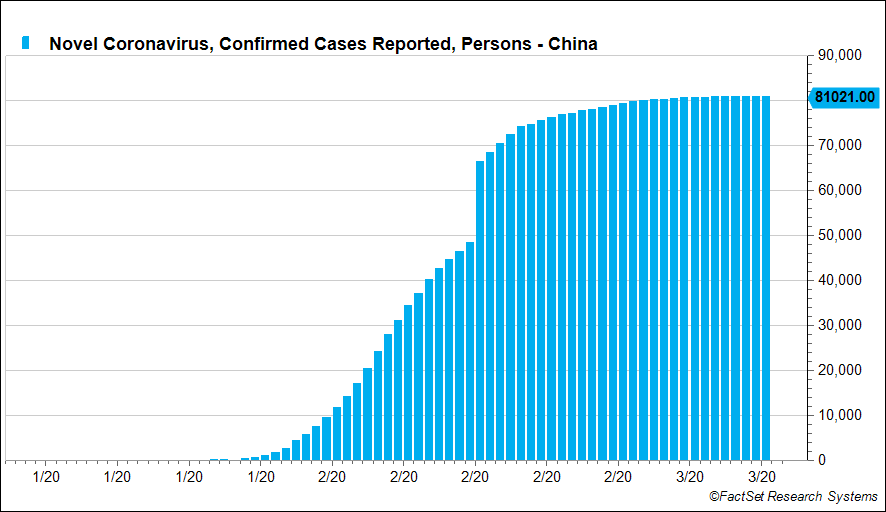
- China, the original epicenter of the viral outbreak, has now the best performing country market year-to-date, as viral infection of COVID-19 continues to drop – now close to zero new cases per day (see chart, right; source FactSet Data Systems, as of 3/14/20). China’s market action may be an early window into how Western markets will react once COVID-19 infection rates start to slow. New cases in South Korea, Singapore, and Hong Kong also appear to be slowing, suggesting that it is possible to contain the virus with concerted effort. We think it’s telling that, right now, the only Apple Stores in the world that are open are, perhaps ironically, ones in Greater China. While the US was initially slow to react to the threat, that is now changing, with the focus on social distancing now reaching every facet of public life. The Trump administration halted travel from Europe, the UK, and Ireland and declared a state of national emergency; it’s now clear that Americans in general are taking the viral threat seriously.
- Policymakers on the Case: According to Cornerstone Macro note on March 14, countries around the world have already announced fiscal stimulus amounting to roughly $225 billion, with new announcements every day: “This follows massive classic monetary stimulus (e.g., Bank of Europe, Bank of Canada rate cuts last week), and growing central bank liquidity injections (e.g., Fed, Bank of Japan, Peoples Bank of China).” US policymakers are in active discussion on further fiscal stimulus to protect US consumers and businesses, following the sick-leave and unemployment assistance bill awaiting vote in Congress on Friday. On the monetary front, the Federal Reserve made a surprise announcement on Sunday to lower the Fed Funds Rate back to 0% and to provide liquidity through the purchases of US Treasuries and mortgage backed securities. While the initial stock market reaction was negative, we believe this Fed is determined not to get ‘behind the curve,’ and is open to more creative options if this doesn’t have the desired effect.
- Event-Driven Bear Markets Tend to be Shorter: According to Goldman Sachs research going back to the 1830s, US bear markets caused by an ‘event-driven’ exogenous shock, like a war or oil price drop, tend to be shallower and shorter than a ‘structural bear’ (driven by financial bubbles and structural imbalances) or a cyclical bear (driven by rising interest rates and impending recessions):
- “Structural bear markets on average see falls of 57%, last 42 months and take 111 months to get back to starting point in nominal terms. Cyclical bear markets on average see falls of 31%, last 27 months and take 50 months to get back to starting point in nominal terms. Event-driven bear markets on average see falls of 29%, last 9 months and recover within 15 months in nominal terms.” (Goldman Sachs Portfolio Strategy, 3/9/20)
The key, of course, is how quickly the US economy can get back on a track resembling its trajectory heading into March – this will likely determine whether this bear market ends up being ‘event-driven’ or morphing into something more like a cyclical bear.
Download 03.16.2020 | Weekly View
Authored by
-

Chris Konstantinos CFA®
Managing Partner | Chief Investment Strategist