
Your choice regarding cookies: We use cookies when you use this Website. These may be 'session' cookies, meaning they delete themselves when you leave the Website, or 'persistent' cookies which do not delete themselves and help us recognize you when you return so we can provide a tailored service. However, you can block our usage by adjusting your browser settings to refuse cookies.
Recession Fears Persist Despite Encouraging Data
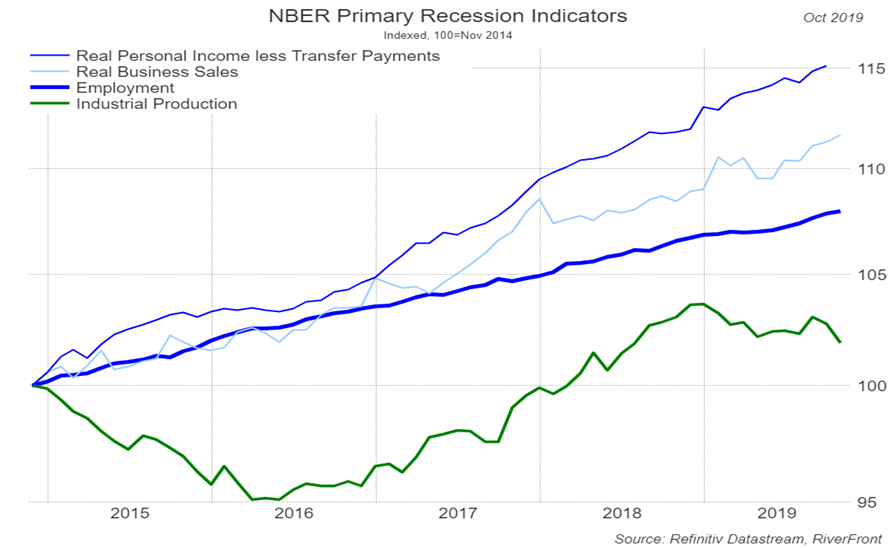
Currently, we believe the differences between slow growth and no growth are enough to keep the US economy limping through the economic expansion despite recessions in other parts of the world. The National Bureau of Economic Research (NBER) is the organization tasked with determining the beginning and end of recessions in the US. Their research uses employment, industrial production, real personal income, and real business sales as data points for determining the health of the US economy. According to the, NBER 3 out of 4 of their indicators show continued growth, as can be seen in the chart above.
Real personal Income (less transfer payments) continues to grow. Wages continue to rise which is healthy for consumers and healthy for the economy. Recent data suggests wages are growing between 3%-4% in the US as businesses are paying up due to a tighter labor market. While real wage growth is great for consumers, it is not necessarily great for businesses since it negatively impacts profit margins. This helps explain the more sluggish earnings growth companies have experienced in 2019.
Real business sales trends remain positive. Sales, across a wide spectrum of surveys, remain in positive territory. For calendar 2019, analysts are predicting a blended revenue growth rate of 3.8% for companies in the S&P 500, according to FactSet. While 3.8% growth may not be considered robust we believe that slow growth is better over the long-run than unsustainable fast growth or no growth at all. Looking beyond companies in the S&P 500, the National Federation of Independent Business’ most recent report on business trends was also very encouraging as actual sales volumes remained steady. Lastly, retail sales continue to trend positively which is encouraging as we are at the height of the all-important holiday selling season.
Employment trends remain robust. This year, US unemployment fell to 50-year lows of 3.5%. The unemployment rate has also improved dramatically in critical categories such as minorities, youth, and low income. As one can see in the above chart, employment has steadily grown over the past 5 years despite the occasional negative surprise in the monthly non-farm payroll report. Importantly, the current unemployment rate is within the range considered ‘normal’ by the Federal Reserve, which means that the Fed is unlikely to reverse their accommodative stance because they are worried about the economy overheating, in our view.
Industrial Production has drifted lower. This data point has proven to be the wet blanket of the four indicators watched by the NBER as it has been zig-zagging over the past few months. After slumping in July and rebounding in August, the September and October data fell more than expected. Analysts blame a loss of momentum in manufacturing as being the culprit, which many believe is a function of the ongoing trade tensions. It is no secret that resolution to the trade tensions across the globe, not just with China, could have positive implications for global growth.
Which New Market High Will Be The High?

While there are many economic data points that analysts use to call a recession, a market top is more difficult. Valuations are subjective and there is no one technical indicator that is considered the best. In 2019, there have been around 20 new highs – depending on the index being referenced. We view November’s string of new highs on the S&P 500 as a technical positive and note that developed international indexes have also moved above some important resistance levels. Another technical indicator that we use compares the number of new highs to the number of new lows, commonly called a breadth indicator, is also positive on the S&P 500 at this time. While our near-term overhead target is around 3200 for the S&P 500, we believe it can exceed that level as we are in, what is typically, a positive period seasonally.
What Does It All Mean?
Ideally, we would like to see each of the four NBER economic indicators moving in a positive direction. However, not every indicator has to be improving for the US economy to continue to expand. Recessions are generally declared, after the fact, in hindsight. We continue to be encouraged by the 3 out of 4 indicators that remain positive and our strategies reflect that cautious optimism. We believe our tactical market signals confirm our fundamental views, so we expect to turn our calendar to a new year and a new decade poised for continued market strength and reaccelerating economic growth.